
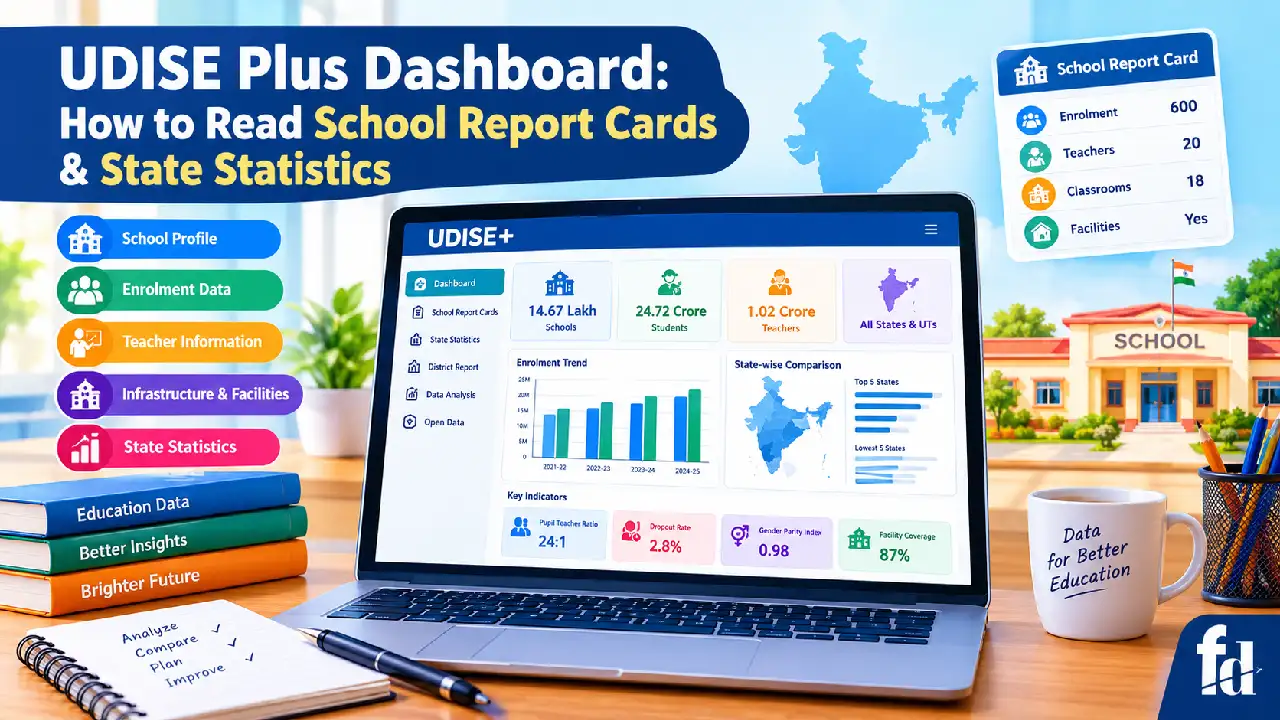
Understanding a school’s facilities, student enrolment, teacher availability, and overall educational profile can be difficult when information is spread across different reports.
The udise plus school report card dashboard helps readers explore school-level information and understand broader education trends through India’s Unified District Information System for Education Plus (UDISE+).
Whether you are a parent researching a school, a teacher checking school records, a student studying education statistics, or a researcher comparing states, knowing how to read these reports can help you make better-informed decisions.
This guide explains how to access the available information, understand the main indicators, and avoid common mistakes when interpreting school data.
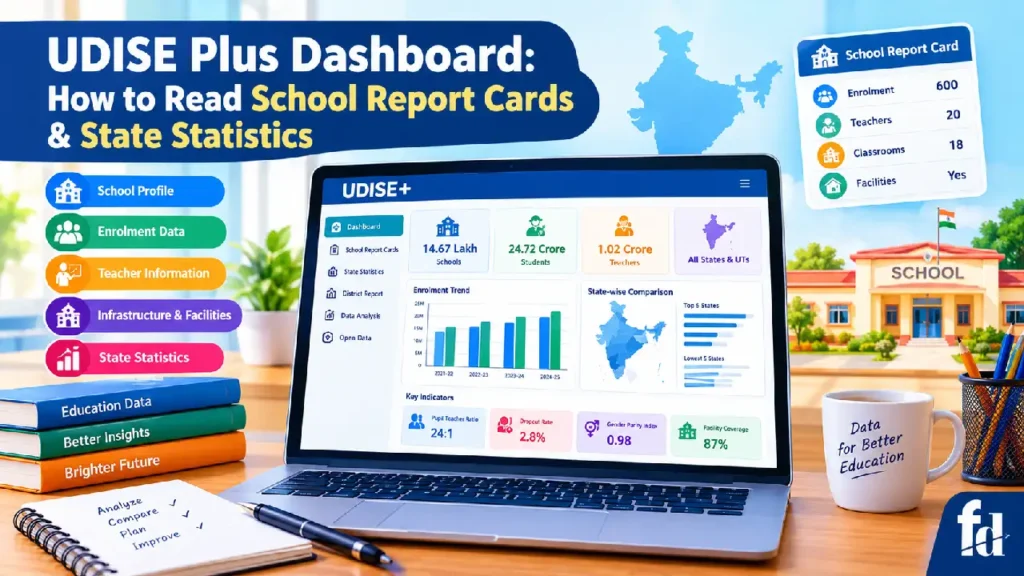
What Is the UDISE Plus Dashboard?
UDISE Plus is India’s school education data system, developed under the Ministry of Education. It collects information about recognised schools through a structured reporting process involving school authorities and education departments. The information covers areas such as school management, student enrolment, teachers, infrastructure, facilities, and other education-related indicators.
The udise plus dashboard makes selected information available through online reporting and data-viewing facilities. Depending on the portal section, reporting year, and access permissions, users may be able to explore school profiles, district summaries, state-level statistics, and other published information.
For example, a parent researching a school may want to check whether it has a library, separate toilets, a drinking-water facility, or an adequate number of teachers. An education researcher may instead be interested in enrolment patterns across several states. Both readers can benefit from understanding the same system, but they will use different indicators to answer their questions.
What Does UDISE+ Stand For?
UDISE+ stands for Unified District Information System for Education Plus. It builds on India’s earlier UDISE school-data system and uses digital processes to support the collection, validation, and reporting of school education information.
The system is important because India has a very large and diverse school network. Collecting information in a common format helps education authorities review school conditions, understand differences between regions, and plan improvements.
The data is also useful for public understanding. However, a report should always be read in the context of its reporting year, the indicators it contains, and the source from which it was published.
Why Is This Dashboard Important?
School education data is useful when it answers a clear question. Rather than treating every figure as equally important, readers should identify what they need to understand first.
Here are some practical examples:
- Parents can review available school-profile information before contacting a school.
- Teachers and school leaders can use reported figures to identify records that may need checking.
- Students can use published statistics for education projects, assignments, and research.
- Researchers can compare enrolment, infrastructure, and staffing patterns across regions.
- Education planners can use aggregate data to identify areas that may need additional attention.
A school profile is not, however, a complete judgement of teaching quality. A school with many facilities may still face learning challenges, while a school with fewer facilities may have strong teaching practices. The data should support further investigation rather than replace it.
How to Access the Official Dashboard and School Report Cards
The safest starting point is the official government website rather than an unofficial page that republishes school information. UDISE+ has several related portals, and each serves a different purpose. The main portal provides links to reporting tools, dashboards, and other resources, while the public-facing school search facility helps users find available information about individual schools.
Official UDISE+ portal
Start here to find dashboard links, reporting resources, and education statistics.
Know Your School
Search for a school using available search fields and explore school information.
Official reports and statistics
Use published reports to check state-level figures, definitions, and reporting years.
View Ministry of Education statistics
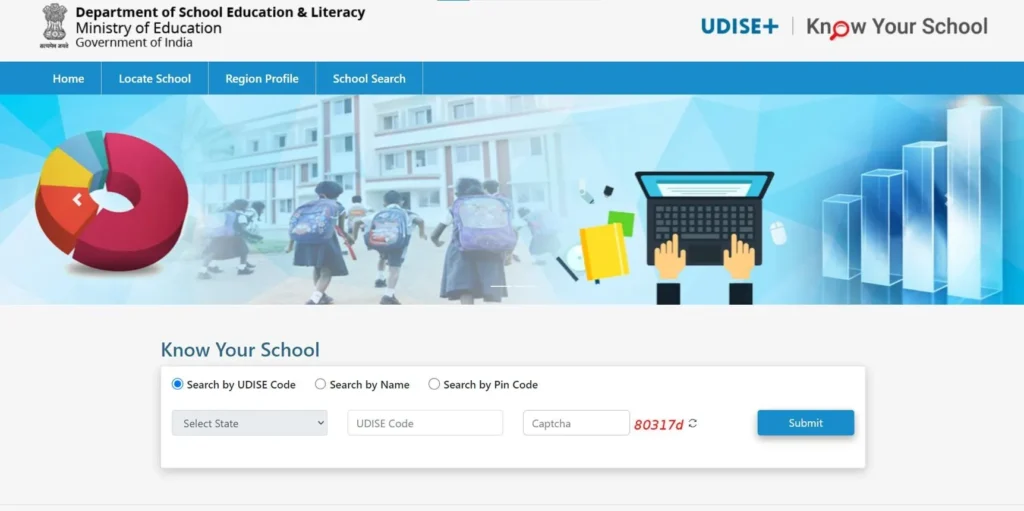
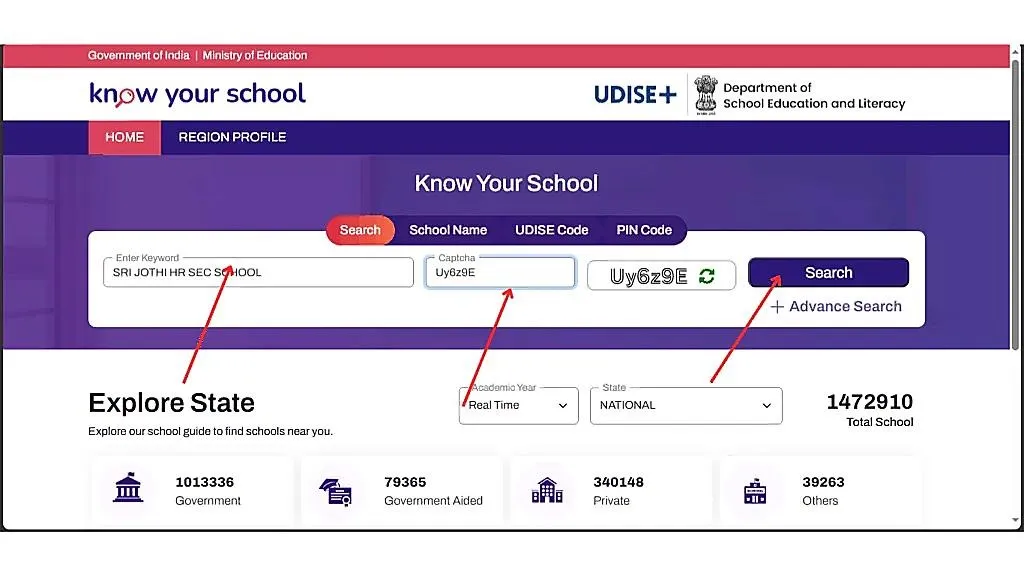
The official Know Your School website provides search fields for a school name, UDISE code, PIN code, and other available criteria. The page may require a CAPTCHA before displaying search results.
Step 1: Open the Correct Website
Open the official UDISE+ website in your browser. Look for links to the dashboard, school report card, or school search facility.
Do not assume that every UDISE+ page is intended for public browsing. Some sections are designed for authorised school officials and education department staff who submit or manage records.
If you only want to find a school or read publicly available information, begin with the Know Your School facility. If you need a complete statistical report for research, the Ministry of Education’s published reports may be more useful.
Step 2: Search for the School
Open Know Your School and choose an appropriate search option.
You can try:
- School name: Enter the school’s name as accurately as possible.
- UDISE code: Use the school’s unique identification code if you know it.
- State and school name: Narrow your search when several schools have similar names.
- PIN code: Search within a particular postal area where this option is available.
For example, imagine you are looking for a government secondary school in Bengaluru. Several schools may have similar names, so searching with the state and school name together can help narrow the results. If you already know the school’s UDISE code, using it can make identification easier.
Check the location and school details before opening a result. A school with a similar name in another district may not be the institution you intended to find.
Step 3: Open the Available School Information
Once you identify the correct school, review the information made available on the portal. Depending on the facility and the selected academic year, this may include school identity, management type, classes offered, facilities, enrolment, and teacher-related details.
Some detailed reporting functions require an authorised login. The official reporting module, for example, is intended for users with the required credentials. Do not treat a login-only page as evidence that a school has no report card.
If a page is unavailable, try the public search facility or look for the relevant published report on the Ministry of Education website.
Step 4: Confirm the Academic Year
This is one of the most important steps.
A school profile may display information for a particular academic year, while a national or state report may cover a different year. A figure published in a report for 2024–25 should not automatically be described as a 2025–26 figure.
Before recording a number, check:
- The academic year shown on the page.
- The date or reporting period of the published report.
- Whether the figure is a school-level value or a state or national total.
- Whether the report uses the same definition as the report you are comparing it with.
These checks prevent incorrect conclusions caused by mixing figures from different reporting periods.
How to Read a School Report Card
A udise plus report card should be read as a structured record of a school’s reported characteristics, not simply as a score that tells you whether the school is good or bad.
Different report layouts may use different labels, but the main task is the same: understand what each field measures, check the reporting year, and decide whether the information answers your question.
1. School Identification and Basic Details
Start with the school’s identity.
Common fields may include:
Field | What it tells you | What to check |
UDISE code | The school’s unique identification code | Confirm it belongs to the correct school |
School name | The recorded name of the institution | Look for spelling or name changes |
State and district | The school’s location | Confirm the correct administrative area |
Management type | Whether the school is government, government-aided, private, or another category | Use the same categories when comparing schools |
School category | The broad level or type of school | Check which classes the school serves |
Academic year | The reporting period | Match the year across reports |
The UDISE code is especially useful when two institutions have similar names. It can also help when researching a school that has changed its name or is known locally by a different name.
Example: A parent searching for a school called Government High School may find several results. Instead of relying only on the name, the parent should verify the district, location, and identification code.
2. School Management and Type
Management information helps explain how schools are grouped in official statistics.
Common categories include government schools, government-aided schools, private unaided schools, and other reported management types. These categories matter because enrolment, staffing, infrastructure, and funding arrangements can differ across them.
When comparing two schools, make sure they belong to the categories you intend to compare. A government primary school and a private senior secondary school do not necessarily serve the same population or have the same operating needs.
Management type is a descriptive field. It should not be treated as a direct measure of educational quality.
3. Classes and Educational Levels
Check which classes the school offers. A school serving primary grades has different staffing and infrastructure needs from a school that also offers secondary or higher secondary education.
For instance, a school that offers Classes 1–5 may not have the same subject-teacher requirements as a school offering Classes 1–12. Comparing their total teacher counts without considering the classes offered can lead to misleading conclusions.
When studying school statistics, compare institutions with similar grade coverage whenever possible.
4. Enrolment and Student Numbers
UDISE Plus enrolment data helps readers understand how many students are recorded in a school and how enrolment is distributed across classes or other reported categories.
Depending on the report, figures may be available by:
- Class or educational level.
- Gender.
- Social category.
- School management.
- Other reporting categories supported by the dataset.
Look at the total enrollment first, then check how it is distributed. A school with 600 students may have a very different pattern from another school with the same total if one serves mostly primary grades and the other serves secondary and higher secondary grades.
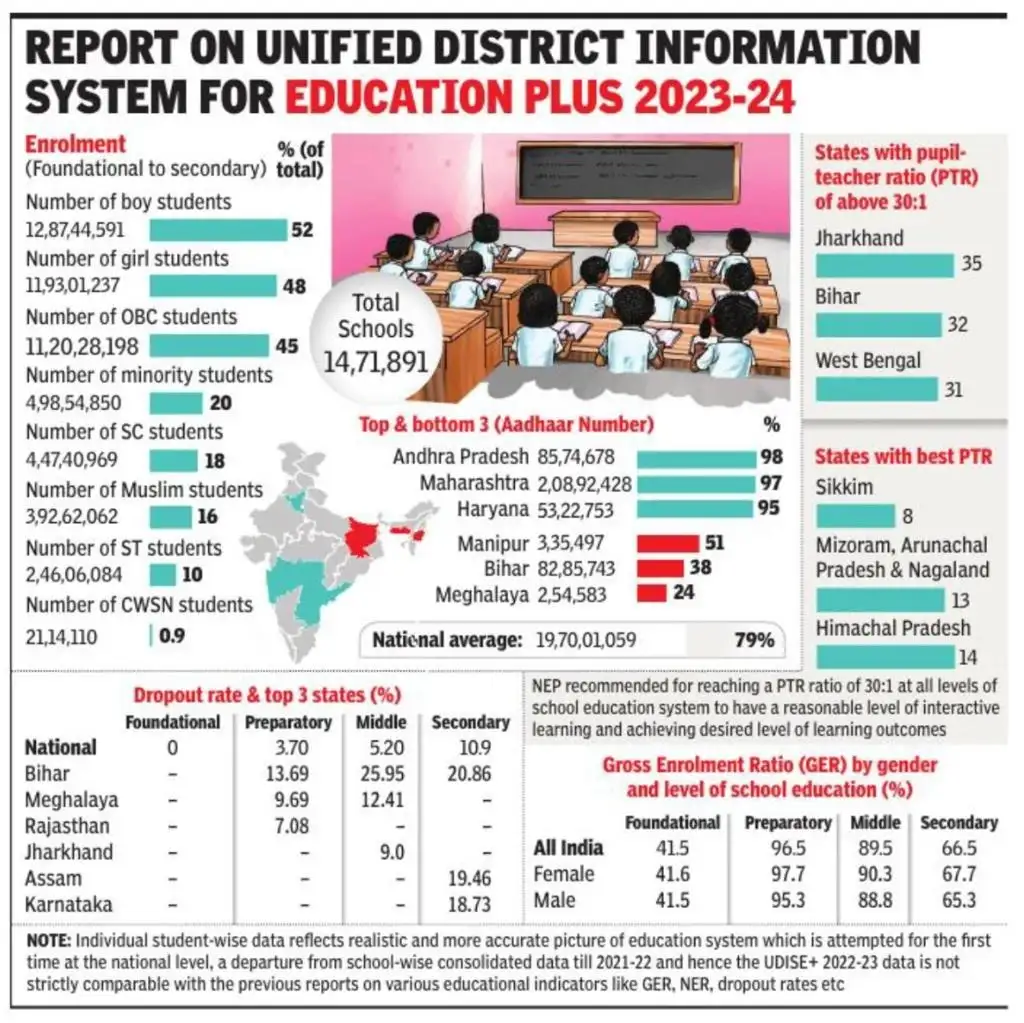
The Ministry of Education’s UDISE+ 2024–25 report recorded approximately 24.69 crore students across recognised schools in India. Its summary also explains that individual student-level data has been collected nationally through the system since 2022–23.
These national figures provide context, but they do not tell you how many students attend any particular school. For that, you need the relevant school-level record.
5. Teacher Information
Teacher-related information can help readers understand staffing patterns. Depending on the report, the available fields may include the number of teachers, gender distribution, qualifications, or other professional details.
Do not judge staffing adequacy using the total number of teachers alone. You should also consider the number of students, the classes offered, and the distribution of teachers across educational levels.
For example, a school with 20 teachers and 600 students has a different overall staffing pattern from a school with 20 teachers and 300 students. However, these totals do not reveal whether the school has enough teachers for each subject or class.
To assess that, readers need more detailed information than a single headline figure can provide.
6. School Facilities and Infrastructure
Infrastructure is another important section to review. Available fields may cover facilities such as:
- Drinking water.
- Toilets for boys and girls.
- Electricity.
- Library or reading facilities.
- Classrooms.
- Computer or digital-learning facilities.
- Accessibility features for children with special needs.
The exact fields shown can vary by report and academic year.
A school may report that a facility exists, but that does not necessarily tell you whether it is functional, well maintained, or sufficient for the number of students. For example, a school might have a library room but a limited collection of books. The record may establish the reported presence of a facility without explaining its day-to-day quality.
Use these figures as a starting point for questions that may need further verification.
7. Attendance, Transitions, and Other Indicators
Some reports and related education publications include indicators concerning student participation, progression between educational levels, or dropout rates.
These measures should be interpreted carefully. Enrolment is not the same as attendance, and a student moving from one educational level to another is not the same as completing a course successfully.
If a report shows a change in enrollment, it does not automatically prove that attendance has improved or that fewer students are leaving school. The reader needs to check which indicator is being measured and whether the same method was used across the years being compared.
How to Read a School Profile Using a Practical Example
Consider the following fictional school profile. These figures are for demonstration only and do not represent a real school or official UDISE+ record.
Indicator | Illustrative figure |
Total students | 600 |
Total teachers | 20 |
Classrooms | 18 |
Library facility reported | Yes |
Drinking water facility reported | Yes |
Electricity connection reported | Yes |
Separate toilets reported | Yes |
A reader can use this table to identify areas for further investigation.
First, the school has 600 students and 20 teachers. Dividing the student count by the teacher count gives an overall ratio of 30 students per teacher. This is a useful starting point, but it does not show whether every class has an appropriate teacher or whether the teachers are distributed evenly across subjects.
Second, the school reports several basic facilities. That is useful information, but a parent may still want to confirm whether the drinking water is safe, the toilets are functional, and the library is accessible to students.
Finally, the school has 18 classrooms for 600 students. This figure alone cannot establish whether classrooms are overcrowded because the number of sections, class schedules, and shift arrangements also matter.
The main lesson is simple: read related indicators together. A single figure rarely tells the complete story.
How to Understand District-Level School Reports
A school report provides information about an individual institution, whereas a district report brings together information from multiple schools within an administrative area.
A udise plus district report can help readers understand patterns that are difficult to identify by examining schools one at a time. It may include aggregate figures for schools, students, teachers, facilities, and other indicators, depending on the publication.
For example, a district may have many schools but still face challenges in providing secondary education in remote areas. Another district may have fewer schools but a larger share of schools offering higher secondary classes. Total school counts alone cannot explain these differences.
When reading a district summary, check three things:
- The number of schools covered: Find out whether the report represents all relevant schools or a defined subset.
- The population represented: Consider the district’s size, school-age population, and rural or urban distribution.
- The indicators being compared: Make sure the figures use consistent definitions and reporting periods.
District statistics are especially useful for identifying questions that need closer examination. They should not be treated as proof that every school within a district has the same conditions.
Where to Find Official Statistics and Downloadable Reports
The official UDISE+ website and the Ministry of Education’s publications section are useful starting points for finding published figures.
The Ministry’s statistics page lists UDISE+ reports for different academic years, including reports organised according to the existing reporting structure and the structure aligned with the National Education Policy 2020.
Use the following resources according to your purpose:
- UDISE+ official portal — for the main system and its linked facilities.
- Know Your School — for searching and exploring school information.
- Ministry of Education statistics — for official reports and published education statistics.
- UDISE+ archived dashboard — for older dashboard information and historical reports.
- UDISE+ Data Sharing Portal — for information about requesting access to data through the official data-sharing facility. Access to downloadable data may require registration or approval.
If you are conducting academic research, download the relevant report and retain its title, academic year, publication date, and source link in your notes. This makes it easier to verify your findings and cite the correct document.
A school profile and a national statistical report may present similar information in different formats. Always check the definitions and reporting year before combining their figures.
Common Mistakes to Avoid When Reading School Report Cards
Even accurate statistics can lead to incorrect conclusions when they are read without context. Avoid these common mistakes:
- Mixing academic years: Do not compare one school’s 2024–25 data with another school’s 2025–26 data without clearly explaining the difference.
- Treating facilities as proof of quality: The reported presence of a library or computer room does not establish how effectively it is used.
- Comparing unlike schools: Consider grade coverage, management type, location, and student population.
- Confusing totals with percentages: A school with more students may have a higher number of girls enrolled but a lower proportion of girls than another school.
- Assuming every figure is final: Published data may be revised, and some portals may display information that differs from an older report.
- Treating the report as a ranking: A school profile is not necessarily a standardised score of academic achievement.
These checks help parents, teachers, and researchers make fairer comparisons and avoid drawing conclusions that the available evidence cannot support.
The next step is to move from individual school records to larger patterns. By understanding how school-level information fits into district and state summaries, readers can begin to interpret the wider education system and identify meaningful differences between regions.
How to Read State-Wise School Statistics
State-level statistics help readers understand how school education differs across India’s states and union territories. While a school report card focuses on one institution, state-level reporting combines information from many schools to show wider patterns in enrollment, staffing, infrastructure, and access to education.
The udise plus statistics published through official dashboards and reports can help answer questions such as: How many students are enrolled in schools across a state? How many teachers are recorded? What proportion of schools report access to electricity or drinking water? Are enrolment patterns changing between academic years?
These figures are useful for understanding the education system, but they need context. States differ in population, geography, urbanisation, school networks, and the distribution of students across educational levels. A state with a large population may have more schools and teachers than a smaller state without necessarily providing better access or learning outcomes.
Step 1: Select the State and Reporting Year
Start with the official UDISE+ portal or the Ministry of Education statistics page. Look for the relevant state-level dashboard, report, or downloadable publication.
Before recording any figure, check:
- The state or union territory covered.
- The academic year of the data.
- Whether the report includes all relevant school management categories.
- Whether the figure is a total, percentage, average, or ratio.
- Whether the data is provisional, final, or subject to revision.
For example, if you are comparing Karnataka and Kerala, you should use the same reporting year and comparable definitions. Comparing different years without explaining the difference can make ordinary changes in reporting look like changes in school performance.
Step 2: Understand the Main State-Level Indicators
A state report may include several types of measures. Each one answers a different question.
Indicator | What it measures | What it helps you understand |
Number of schools | Schools covered by the report | The size of the school network |
Total enrolment | Students recorded in schools | The number of enrolled students |
Total teachers | Teachers recorded in the dataset | The scale of the teaching workforce |
Pupil-teacher ratio | Pupils relative to teachers | Overall staffing patterns |
School facilities | Reported availability of facilities | Access to basic school infrastructure |
Dropout-related indicators | Reported student exits under the relevant definition | Potential challenges in student retention |
Gender parity | Relative participation of girls and boys under a defined measure | Differences in educational participation |
Do not assume that every dashboard displays all these indicators in the same place. Some may appear in downloadable reports rather than the main dashboard, and the definitions may differ between publications.
Step 3: Compare Percentages as Well as Totals
Suppose State A reports 50,000 schools with electricity, while State B reports 20,000. State A has a higher total, but that does not automatically mean it has better electricity coverage.
To understand coverage, you need the total number of schools in each state and the percentage reporting the facility.
For example, imagine these fictional figures:
Measure | State A | State B |
Total schools | 60,000 | 25,000 |
Schools reporting electricity | 54,000 | 23,750 |
Percentage with electricity | 90% | 95% |
State A has more schools with electricity in absolute numbers, but State B has the higher reported coverage percentage.
This distinction is important when comparing states of different sizes. Totals show scale, while percentages show proportion. Both can be useful, but they answer different questions.
The same principle applies to enrolment, teachers, toilets, drinking-water facilities, and other reported indicators.
Understanding Pupil-Teacher Ratio in UDISE Plus
The pupil-teacher ratio is one of the most useful indicators for understanding the relationship between student numbers and teaching staff. The term pupil teacher ratio UDISE refers to this measure as reported in UDISE+ statistics.
The basic formula is:
Pupil-TeacherRatio=TotalPupilsTotalTeachers
Suppose a school has 450 pupils and 15 teachers. Its overall pupil-teacher ratio is 30:1, meaning there are 30 pupils for every teacher in the calculation.
This does not mean every classroom contains exactly 30 students. It is an overall ratio based on the figures used in the report.
How to Interpret the Ratio
A lower ratio can indicate that there are more teachers relative to the number of pupils. A higher ratio can indicate that fewer teachers are available relative to enrollment. However, neither figure should be interpreted without considering the school’s circumstances.
For example, a school may have a reasonable overall ratio but still lack a mathematics teacher for a particular grade. Another school may have a higher ratio but organise its classes effectively. The overall measure does not show the distribution of teachers by subject, grade, or timetable.
India’s official UDISE+ 2024–25 report recorded a national pupil-teacher ratio of 24:1 in its state-wise summary. The same table reported approximately 14.71 lakh schools, 24.69 crore students, and 1.01 crore teachers.
These figures describe the national school system, not the conditions in every school or state. Use the corresponding state or school figures when investigating a local staffing question.
What Else Should You Check?
When reviewing staffing data, consider the following:
- The number of students in each educational level.
- The number of teachers and their distribution across classes.
- Whether the school has single-teacher arrangements.
- Whether the figures cover the same academic year.
- Whether the school offers primary, secondary, or higher secondary education.
This wider review makes the ratio more meaningful and helps prevent readers from treating one statistic as a complete assessment of teaching quality.
How to Understand UDISE Plus Dropout Rate
The udise plus dropout rate is relevant to anyone studying whether students remain in education or leave before completing a particular stage. However, readers should first check the exact definition and method used in the report they are examining.
A dropout-related measure is not necessarily the same as the number of students who leave a particular school during a year. Student transfers, changes in school records, movement between education systems, and differences in the reporting method can affect how figures should be interpreted.
What Does a Dropout Indicator Tell You?
A dropout indicator can help education authorities identify stages at which student retention may be a concern. It can also guide further investigation into the reasons students leave education.
Possible factors worth examining include:
- Long travel distances to school.
- Household financial difficulties.
- The need to work or provide family care.
- Limited access to suitable secondary schools.
- Safety, accessibility, or other barriers to regular participation.
These are possible explanations, not conclusions that can be drawn from a dropout figure alone.
For example, if a district shows a concerning dropout indicator at the secondary level, the next step is to examine school access, transitions between grades, attendance information where available, and other relevant evidence. The statistic identifies a question that needs investigation; it does not by itself explain the cause.
Why Year-to-Year Comparisons Need Care
A change in a published dropout figure may reflect a real change in student participation, but it can also be influenced by differences in coverage, data collection, or calculation.
Before comparing two years, confirm that the figures use the same definition, educational stage, and reporting method. Do not assume that a change in enrollment automatically represents a change in dropout rates.
For reliable interpretation, use the official UDISE+ reports and read the relevant notes and definitions accompanying the tables.
What Is UDISE Plus GPI?
The udise plus gpi keyword refers to the Gender Parity Index in the context of education statistics. GPI is a measure used to compare participation between girls and boys under a specified educational indicator.
A commonly used enrolment-based formula is:
GPI=Girls’EnrolmentBoys’Enrolment
This simplified formula applies when the chosen measure is girls’ enrolment divided by boys’ enrolment for the same population and educational level. Always check the definition used by the specific report because different indicators can use different denominators.
How to Read a GPI Value
Consider this illustrative example:
Measure | Number of students |
Girls enrolled | 480 |
Boys enrolled | 500 |
GPI | 0.96 |
The calculation is 480 divided by 500, giving a GPI of 0.96.
Under this definition, a value of 1.00 indicates equal numbers of girls and boys in the measured group. A value below 1.00 indicates fewer girls than boys, while a value above 1.00 indicates more girls than boys.
This interpretation concerns the selected measure only. It does not establish that girls and boys have equal attendance, completion rates, learning outcomes, or access to facilities.
Why Gender Parity Matters
Gender parity indicators help researchers identify differences in participation and understand whether access to schooling is balanced. They can also point to areas where more detailed investigation may be useful.
For instance, a state may show a GPI close to 1.00 at the primary level but a different value at the secondary level. Researchers could then investigate whether access to secondary schools, transport, household circumstances, or other factors may help explain the difference.
The GPI itself cannot prove which factor is responsible. It is one part of a broader analysis of participation and educational opportunity.
How to Perform UDISE Plus Data Analysis
Useful udise plus data analysis begins with a clear question. Instead of collecting every available figure, decide what you want to understand and select indicators that help answer it.
A student writing a research paper might examine differences in enrollment between states. A school administrator might study staffing and classroom availability. A district planner might examine which schools report gaps in essential facilities.
A Simple Five-Step Analysis Method
- Define the question. For example, you might want to know whether the pupil-teacher ratio differs between two states.
- Find the official data. Use the same reporting year and the appropriate school-level, district-level, or state-level report.
- Check the definitions. Confirm what the figures count and whether the two datasets use the same categories.
- Calculate relevant measures. Depending on the question, use totals, percentages, averages, or ratios.
- Explain the limitations. State what the results suggest and what cannot be concluded from the available information.
Example: Comparing School Facilities
Imagine that a fictional district has 800 schools and 680 report access to a particular facility.
The reported coverage is:
680800 ✕ 100 = 85%
If another district has 300 schools and 270 report the same facility, its coverage is 90%.
The first district has more schools with the facility in absolute numbers, but the second has a higher reported coverage percentage. A useful analysis would report both figures and explain the difference.
Before drawing conclusions, check whether the school categories and facility definitions match. Also consider whether the reported presence of a facility indicates that it is operational and accessible to students.
How to Use Tables and Spreadsheets
For a small research project, a spreadsheet can help organise published statistics. Useful columns might include:
State | Academic year | Total schools | Total enrolment | Total teachers | Report source |
State A | 2024–25 | Illustrative | Illustrative | Illustrative | Official report |
State B | 2024–25 | Illustrative | Illustrative | Illustrative | Official report |
The entries marked illustrative are placeholders, not actual state figures. Replace them with verified data from the same official reporting period before conducting a real comparison.
Keep the original figures in one sheet and any calculations in another. This makes it easier to check formulas, correct errors, and explain how you reached your conclusions.
UDISE Plus Open Data: What Can You Access?
The term udise plus open data is often used when discussing publicly available school statistics and data that researchers can use for analysis. However, it is important to distinguish between information that anyone can view and datasets that require registration, approval, or authorised access.
The official UDISE+ Data Sharing Portal provides options to register and request access to data. It should not be assumed that every school-level record or dataset is available for unrestricted download.
Public Reports Versus Restricted Data
Resource type | Typical purpose | Important consideration |
Public school search | Find available information about a school | Some fields may not be displayed |
Published statistical report | Review state, district, and national figures | Check the academic year and definitions |
Downloadable report tables | Use figures for research or calculations | Verify units and reporting categories |
Data-sharing portal | Request or access datasets through the official process | Registration or approval may be required |
School management module | Submit or manage school records | Requires the appropriate authorised access |
For most students, teachers, and general readers, published reports are a good starting point. Researchers who need more detailed data should review the data-sharing portal’s requirements before planning their analysis.
How to Use Published Data Responsibly
If you download a report for a school project, article, or research paper, keep a record of the source, reporting year, table number, and date you accessed it.
Avoid publishing identifiable student information or attempting to infer private details from records. Use aggregated statistics wherever possible, and follow the applicable data-access conditions.
When sharing your findings, explain how you calculated percentages or ratios. This makes your work easier for other readers to understand and verify.
How Reliable Is UDISE Plus Data?
UDISE+ uses a structured reporting process. According to the official 2024–25 report, school-level data is uploaded through the system and undergoes verification at block, district, and state levels, with inbuilt validation checks intended to support data quality.
These checks are important, but readers should not assume that every published field is free from error. A record can still require clarification, and figures may be revised as reporting or verification progresses.
Common Data Limitations
- Differences between reporting years
Changes in definitions, coverage, or reporting methods can affect comparisons. Check whether the figures are genuinely comparable before describing a trend.
- Missing or unusual values
A blank field, a zero, or an unusually high value may need further investigation. A zero may represent a genuine situation, a reporting issue, or a specific meaning in the dataset. Do not automatically replace it with an estimate.
- School records and local conditions
A report may indicate that a school has a particular facility, but it may not show whether that facility is currently functional or adequate. Direct confirmation may be necessary.
- Coverage differences
A national total may cover a different set of records or categories from a local report. Read the accompanying notes to understand what is included.
- Administrative data is not the same as learning assessment
UDISE+ is primarily a school education information system. School counts, staffing, facilities, and enrollment can help explain educational conditions, but they do not independently measure how well every student reads, writes, or performs in mathematics.
A careful researcher distinguishes between what the data directly measures and what it may suggest.
UDISE Plus Dashboard vs Other Education Reporting Resources
Readers sometimes confuse UDISE+ school statistics with other education reporting systems. Although they may cover related subjects, their purposes and indicators are not necessarily the same.
Resource | Main purpose | Best use |
UDISE+ | School education information and statistics | School profiles, enrolment, staffing, infrastructure |
Know Your School | Public-facing school search and information | Finding and reviewing available school details |
Performance Grading Index (PGI) | Assessing education-system performance using a defined framework | Understanding broader state or district performance |
Ministry of Education publications | Official education reports and statistical releases | Verifying figures and reviewing trends |
Independent school information websites | May organise school information into searchable formats | Convenience, with verification against official sources |
The Performance Grading Index is related to education monitoring, but it should not be treated as another name for a school report card. Its indicators and assessment framework differ from the school-level records available through UDISE+.
The Ministry of Education publishes UDISE+ reports and PGI reports as separate resources. Readers can consult the official statistics page to identify the appropriate publication for their research.
What About schoolreportcards.in?
The name schoolreportcards.in may be relevant to readers looking for school-report information online. However, I could not verify its current availability or establish that it is an official government service from the sources reviewed for this guide.
If you encounter this or another independent school-information website, check its ownership, update date, source citations, and privacy policy before relying on its figures. For official UDISE+ information, start with the government portal and Ministry of Education publications.
An independent website may offer a convenient way to locate information, but convenience alone does not establish that its records are current or complete.
Practical Checklist for Reading UDISE Plus Reports
Use this checklist whenever you examine a school profile, district summary, or state-level statistical report.
Report-reading checklist
- Open an official UDISE+ or Ministry of Education resource.
- Confirm the school name, UDISE code, state, and district.
- Check the academic year and publication date.
- Identify whether each figure is a total, percentage, average, or ratio.
- Review enrolment alongside teacher numbers and school facilities.
- Check the definitions of GPI, dropout-related measures, and pupil-teacher ratio.
- Compare schools or states using consistent categories and reporting years.
- Investigate missing, zero, or unusual values before drawing conclusions.
- Record the original source and relevant table for research or citation.
- Explain the limitations of the data in your final analysis.
Conclusion
The UDISE Plus dashboard is a useful starting point for understanding India’s school education system. By examining school profiles, enrolment figures, teacher availability, infrastructure, and state-level statistics, readers can develop a clearer picture of how schools are organised and where further investigation may be needed.
The most important skill is learning to interpret the numbers correctly. A school with more teachers is not automatically better staffed, a facility marked as available is not necessarily functional, and a change in enrollment does not automatically explain why students leave school. Reporting years, definitions, and differences between schools must all be considered.
For accurate information, begin with the official UDISE+ portal and the Ministry of Education’s statistics page. Use the published reports to support your analysis, and consult other evidence when you need to understand the reasons behind a particular result.
The goal is not simply to collect school statistics, but to understand what they mean, what they cannot tell you, and how they can support better-informed decisions about education.
FAQs
What is the UDISE Plus dashboard used for?
The dashboard and its related reporting facilities help users explore school education information, including school profiles, enrollment, teachers, infrastructure, and aggregate statistics. The exact information available depends on the selected portal, reporting year, and access permissions.
Researchers can use published reports to compare education indicators across districts and states. Parents can use public school-search facilities to find available information about individual schools. The data is useful for understanding school conditions, but it should not be treated as a complete measure of teaching quality or student achievement.
How can I find a school report card online?
Start with the official UDISE+ website and open the linked school-search facility. You can also visit Know Your School to search using available details such as the school name or UDISE code. Verify the school’s location and identification details before reviewing its profile.
The information displayed may vary by school and academic year. Some reporting and management functions require authorised credentials rather than public access.
Can I compare schools using UDISE+ statistics?
Yes, you can compare available indicators, such as enrolment, teacher numbers, facilities, and pupil-teacher ratios. However, you should compare schools with similar educational levels and consider their management type, location, and reporting year.
A larger school may naturally have more students and teachers, so totals alone can be misleading. Ratios and percentages can help make comparisons more meaningful. Remember that these statistics do not independently establish which school provides the best education.
What is the pupil-teacher ratio?
The pupil-teacher ratio is calculated by dividing the number of pupils by the number of teachers included in the measure.
For example, 300 pupils and 10 teachers produce an overall ratio of 30:1. It helps readers understand staffing in relation to student numbers. However, it does not show the number of students in every classroom or whether the school has enough teachers for each subject. The reporting definition should always be checked before comparing ratios.
What does GPI mean in school statistics?
GPI stands for Gender Parity Index. In an enrolment-based calculation that divides girls’ enrolment by boys’ enrolment, a value of 1.00 indicates equal numbers of girls and boys in the measured group.
A value below 1.00 indicates fewer girls than boys, while a value above 1.00 indicates more girls than boys. The result applies only to the specific population and indicator used. It does not automatically establish equal attendance, completion, or learning outcomes.
Can I download UDISE+ data for research?
Official reports are available through the Ministry of Education’s statistics resources. More detailed datasets may be accessed through the UDISE+ Data Sharing Portal, subject to its registration and access procedures.
Before using the data, check the academic year, definitions, and any conditions attached to access. Cite the original government publication in your research. Do not assume that all underlying school or student records are freely downloadable.
Does a school report card show whether a school is good?
Not by itself. A report card can provide useful information about enrolment, staffing, infrastructure, and other reported characteristics. These details can help identify strengths, gaps, and questions that deserve further investigation.
However, they do not necessarily measure student learning, teaching practices, safety, or the quality of the school environment in full. A balanced assessment should combine available data with other reliable evidence.

Hey, I am Sachin Ramdurg. I run and manage futuredecider.com website that helps students, graduates, and professionals, to find and decide on their future career with ultimate future career advices and future career guides. I have an overall 12+ years of career guidance experience in multiple domains which has helped multiple students, graduates, and professionals to find the best career path for their future.